Context
It is estimated that by 2050 the global population will reach ~9.75 billion, and global food production will need to increase significantly to keep up. Plant diseases threaten both crop yield and nutrient density — and for small farmers, an outbreak can be critical and may threaten to halt operations entirely.
Early detection is essential to maximising yield and increasing food security. Integrating AI into agricultural practices can offer a low-cost solution for disease classification that improves the efficiency and effectiveness of disease management.
Project goal
The goal of this project was to develop a Convolutional Neural Network (CNN) to classify a range of bacterial, fungal, or viral diseases in plant leaves.
This model is a proof-of-concept for image-based classification, built in a Python environment using TensorFlow. I selected MobileNetV2, a lightweight architecture designed to run effectively with limited resources, to test how well it could perform.
Success criteria
For the model to be considered successful, I targeted:
- 90%+ training/validation accuracy
- 0.85+ F1-score
- 85%+ confusion matrix score
These targets were chosen to demonstrate consistency and reliability when classifying plant leaf images.
Dataset
To train, validate, and test performance, I used the PlantVillage dataset: 54,000+ high-quality healthy and diseased plant leaf images across 38 categories and 14 plant species.
I split the dataset into:
- Training (70%): used to fit the model
- Validation (20%): used during training to validate performance with unseen data and reduce overfitting
- Testing (10%): used at the end for evaluation on new, unseen data
Preprocessing and augmentation
- Image resizing: all images resized to 224×224 to match MobileNetV2’s expected input shape
- Normalisation: pixel values scaled into a consistent range (so training is stable)
- Data augmentation: random transformations during training (starting after early epochs), such as flips, small rotations, zoom, and contrast changes — to reduce overfitting to a dataset of similarly formatted images
Model choice: MobileNetV2
MobileNetV2 is a lightweight CNN architecture designed to work with minimal resources while maintaining strong performance.
A major reason it can do this is its use of depthwise separable convolution, which reduces computation while still capturing relationships in feature maps. In simple terms, it breaks a convolution into two steps:
- Depthwise convolution: one filter applied per input channel
- Pointwise convolution: a 1×1 convolution to combine channels
This reduces the number of operations required while preserving useful feature extraction.
Training approach
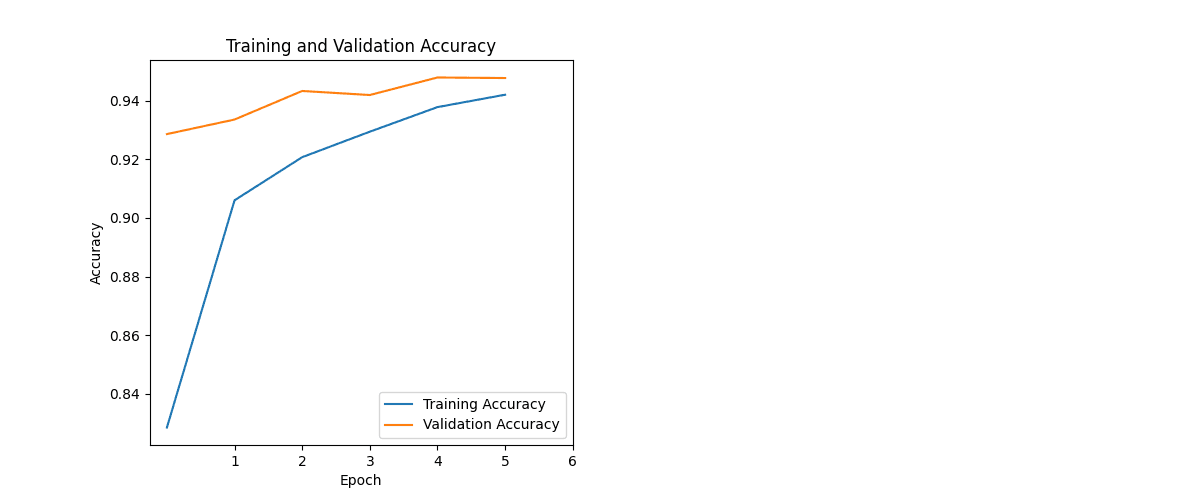
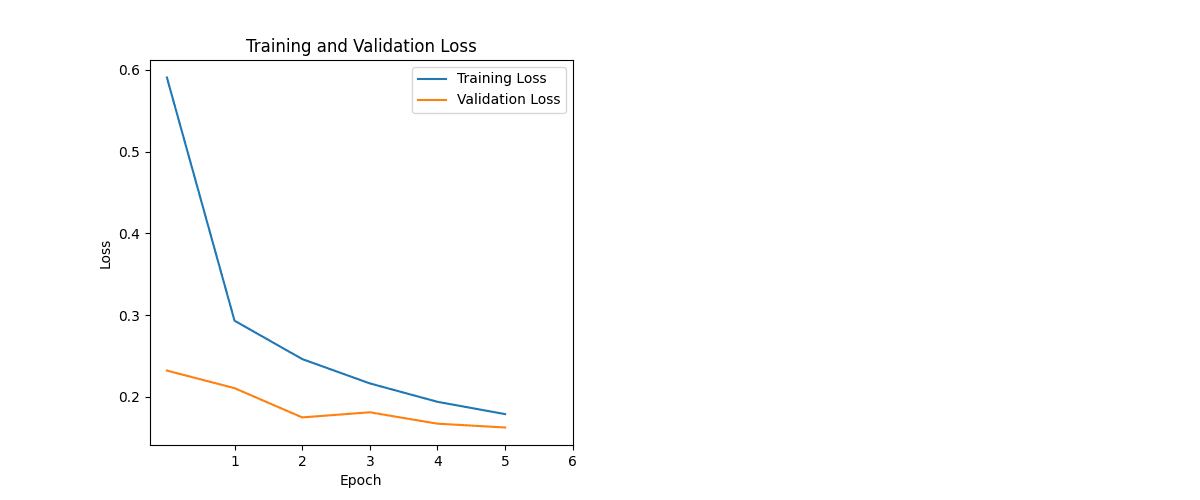
During development, I monitored training and validation accuracy and loss to ensure the model generalised well.
Epochs were kept intentionally low:
- 6 epochs total (the model reached 90%+ accuracy by epoch 2, so the run was kept short to avoid drifting into overfitting)
I also used a learning-rate optimiser:
- ReduceLROnPlateau, configured to monitor validation loss and adjust learning rate if improvement stalled. (This was originally introduced when the project used a smaller dataset; after scaling up the dataset, it became less critical but still supported stable training.)
Evaluation method
Once trained, I evaluated performance using new, unseen data from the test split.
Key metrics included:
- Accuracy
- Recall
- Specificity (correctly identifying healthy samples)
- F1-score (balanced precision/recall)
- Balanced accuracy (useful when class counts differ)
- Confusion matrix (class-by-class performance)
Results
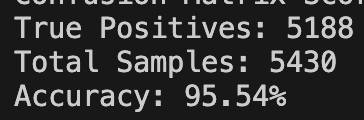
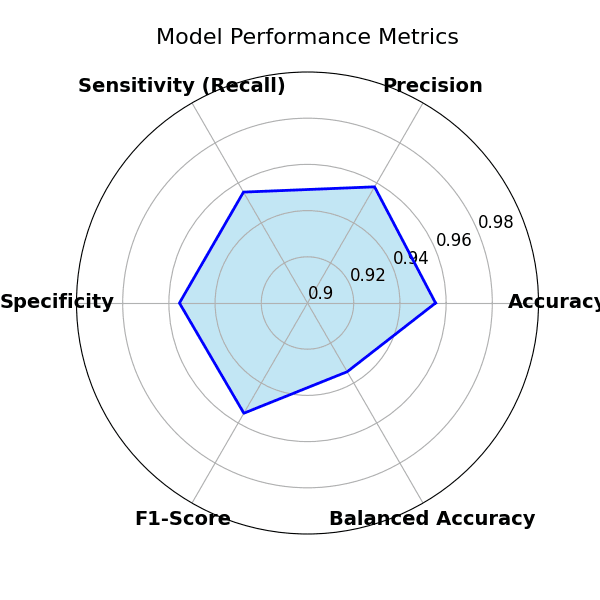
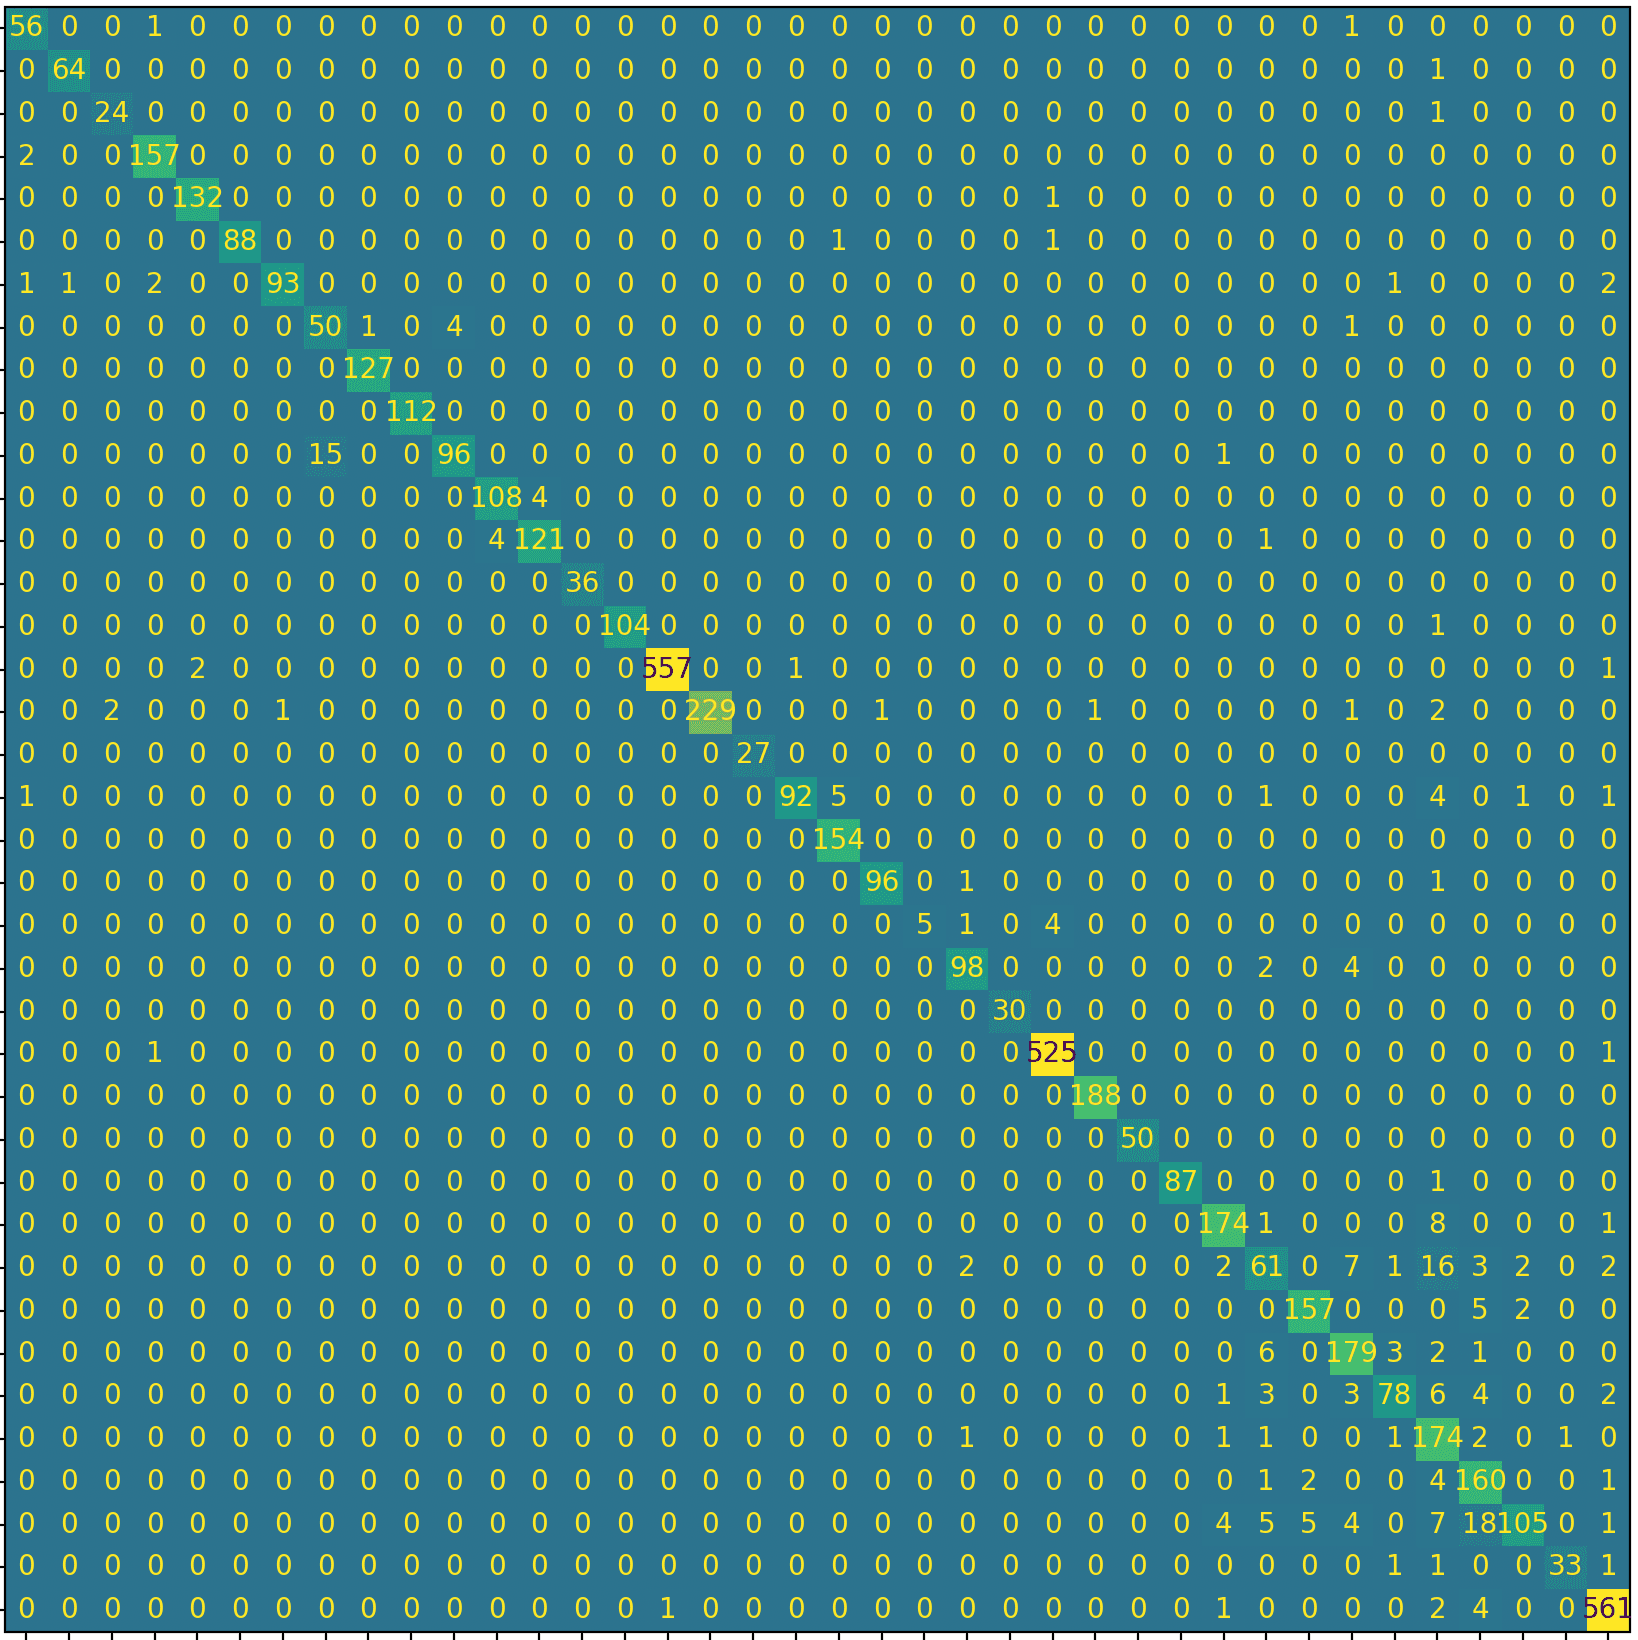
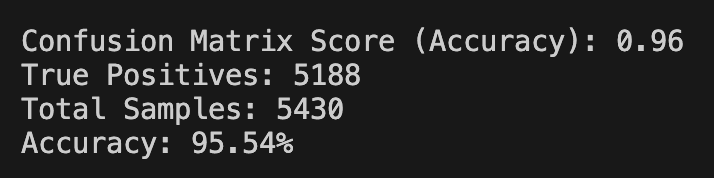
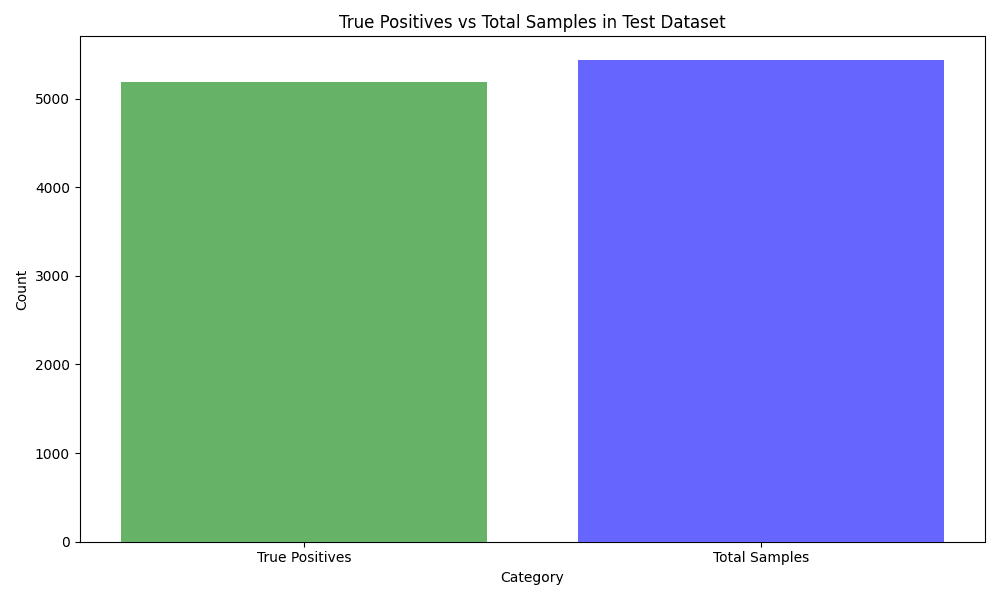
The model generalised well. Training/validation stayed aligned, loss improved steadily, and the confusion matrix showed minimal confusion across classes — meaning it can distinguish between different diseases and healthy samples reliably.
What didn’t work (and what changed)
Originally I planned to only classify disease in apple leaves, thinking a smaller scope would make the project more achievable.
That wasn’t the case. With a small dataset (~5,000 images), the system wasn’t generalising well to unseen data. I tried manipulating complexity and adding epochs, but the real fix was expanding the dataset.
A key learning was the importance of a large and diverse dataset for reliable classification — in practice, tens of thousands of images made a major difference. Moving to PlantVillage was the turning point, and test results improved dramatically (the early apple-only attempt was producing poor test results around the ~40% range).
Practical scenario
Imagine a small farmer noticing an unusual spot on a plant leaf. Without prompt remediation, disease could spread and significantly reduce yield. Integrating this model into a compact, low-cost device could provide an affordable real-time disease detection solution.
Next steps
- Add a simple user workflow: upload/capture a leaf photo → classify + confidence.
- Test real-world field conditions (lighting variation, cluttered backgrounds).
- Prototype edge deployment (e.g. Raspberry Pi) to validate speed and reliability.
- Add a “not sure” confidence threshold to reduce false certainty.